This page describes how to use the Trajectory view of CellTrackVis.
Default state

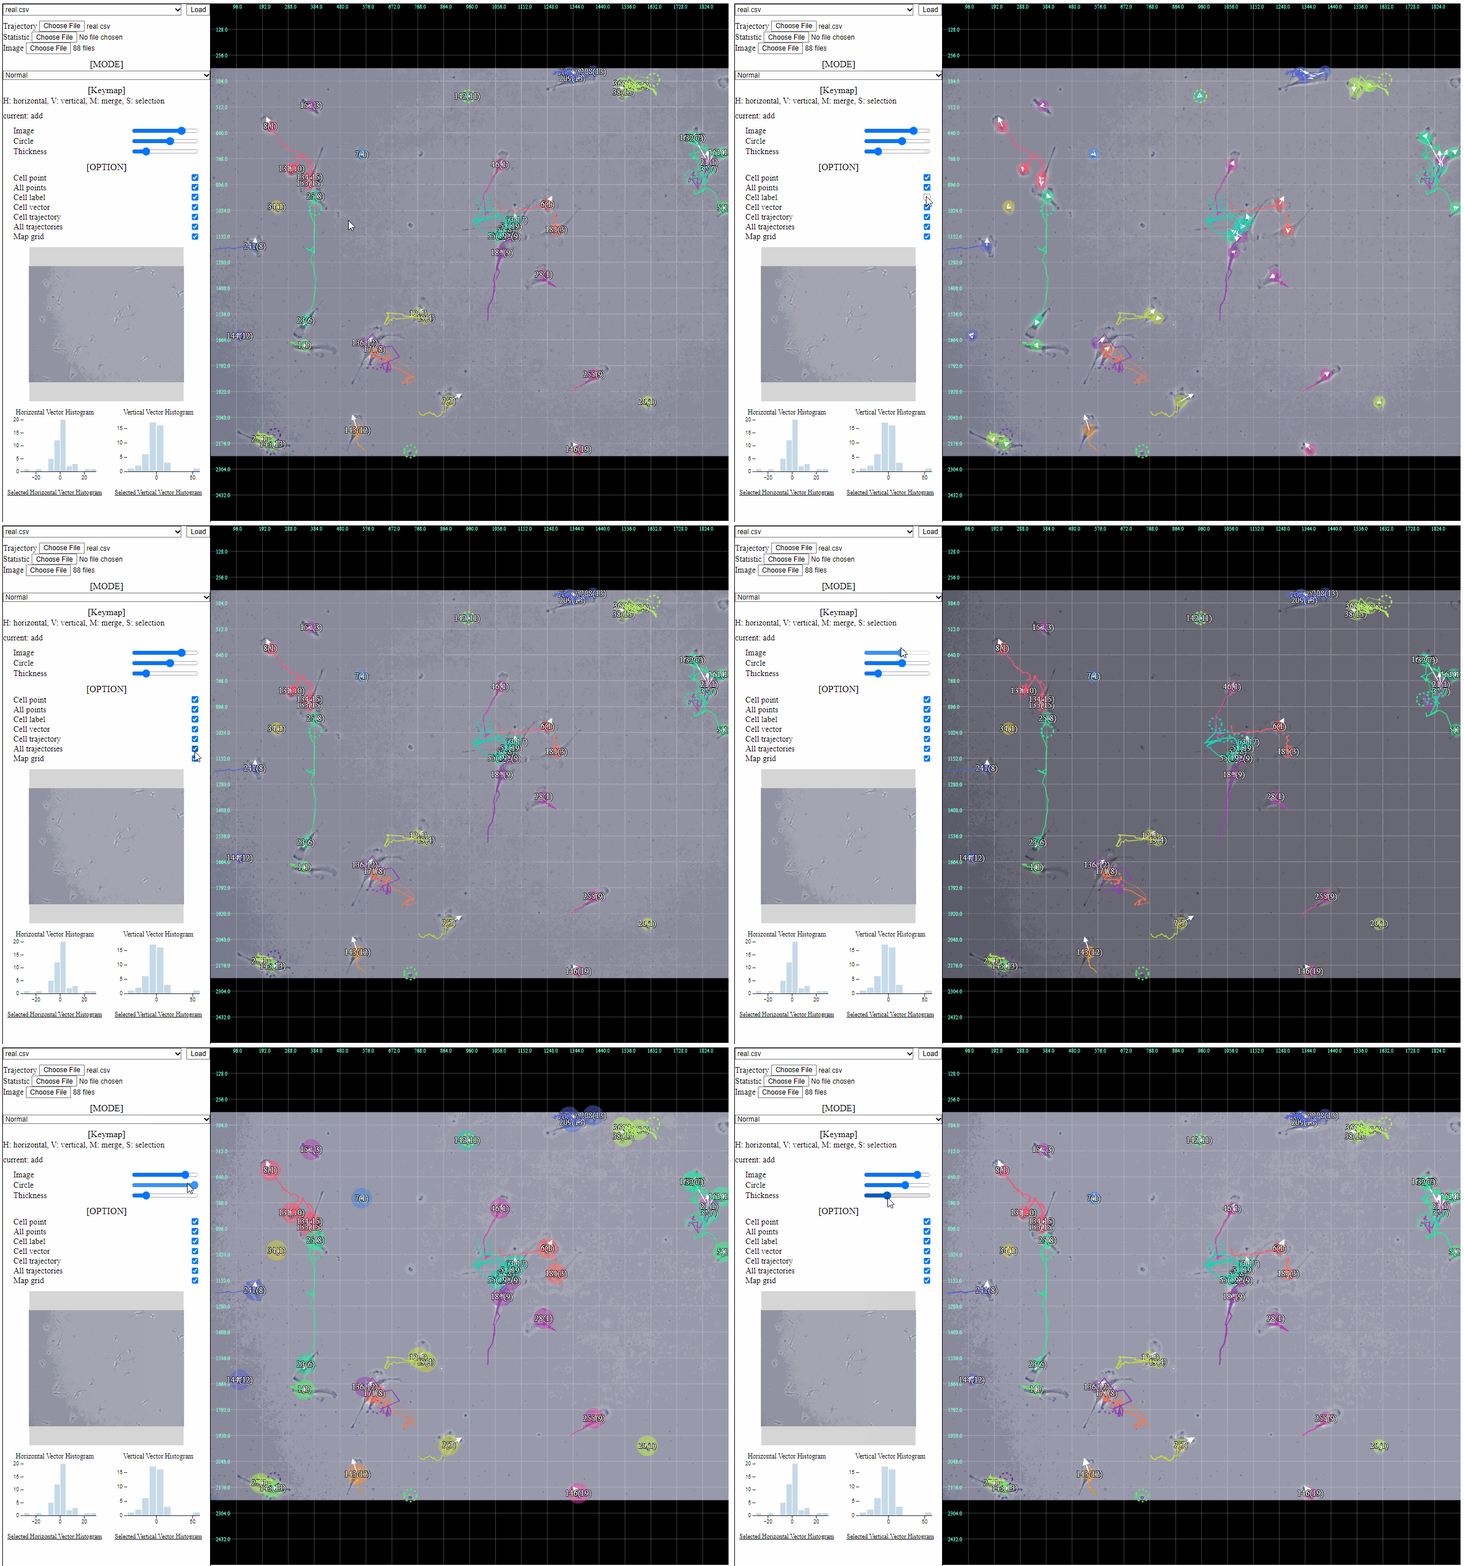
- Current cell positions and vectors of direction to the next position are expressed by circles and arrows, respectively.
- Solid circles or lines denote currently living cells’ locations or trajectories.
- Dotted circles or lines denote already disappeared cells’ locations or trajectories.
Cell and trajectory selection

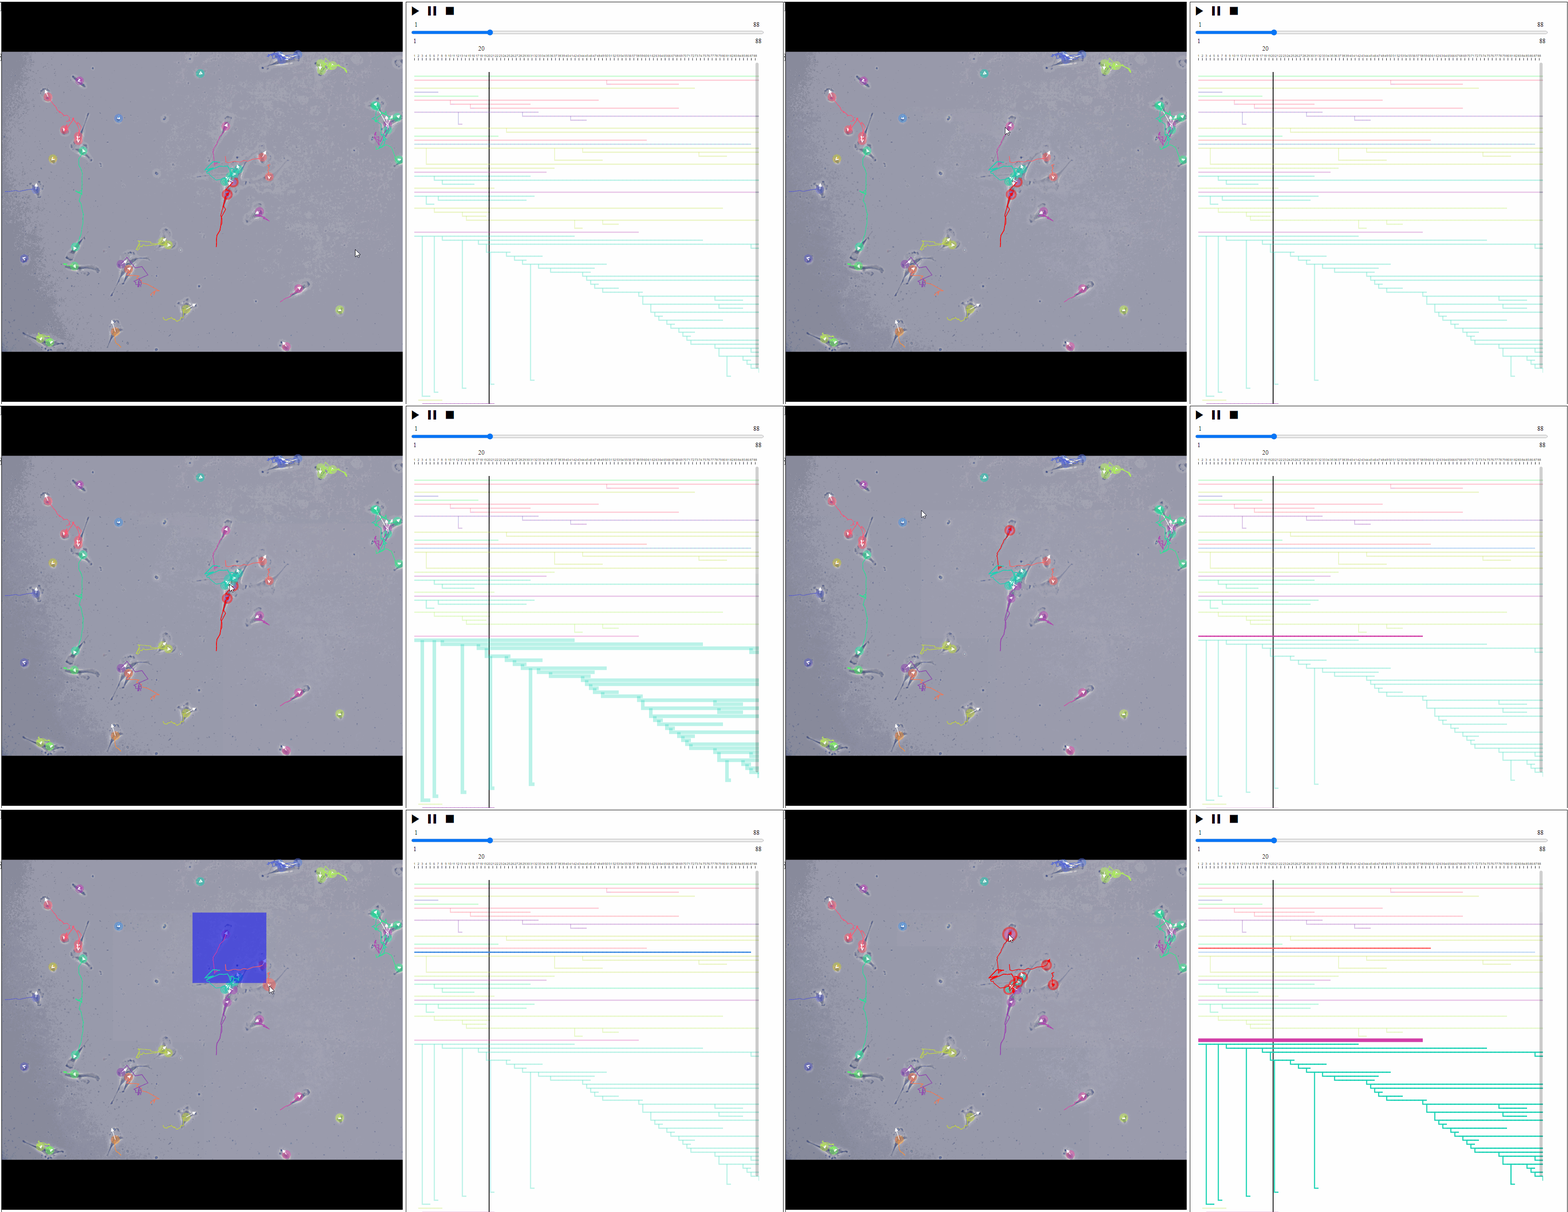
- Cells of interest are selected and highlighted after clicking them.
- Relevant lineages are also highlighted in the Lineage view.
Zoom in and out

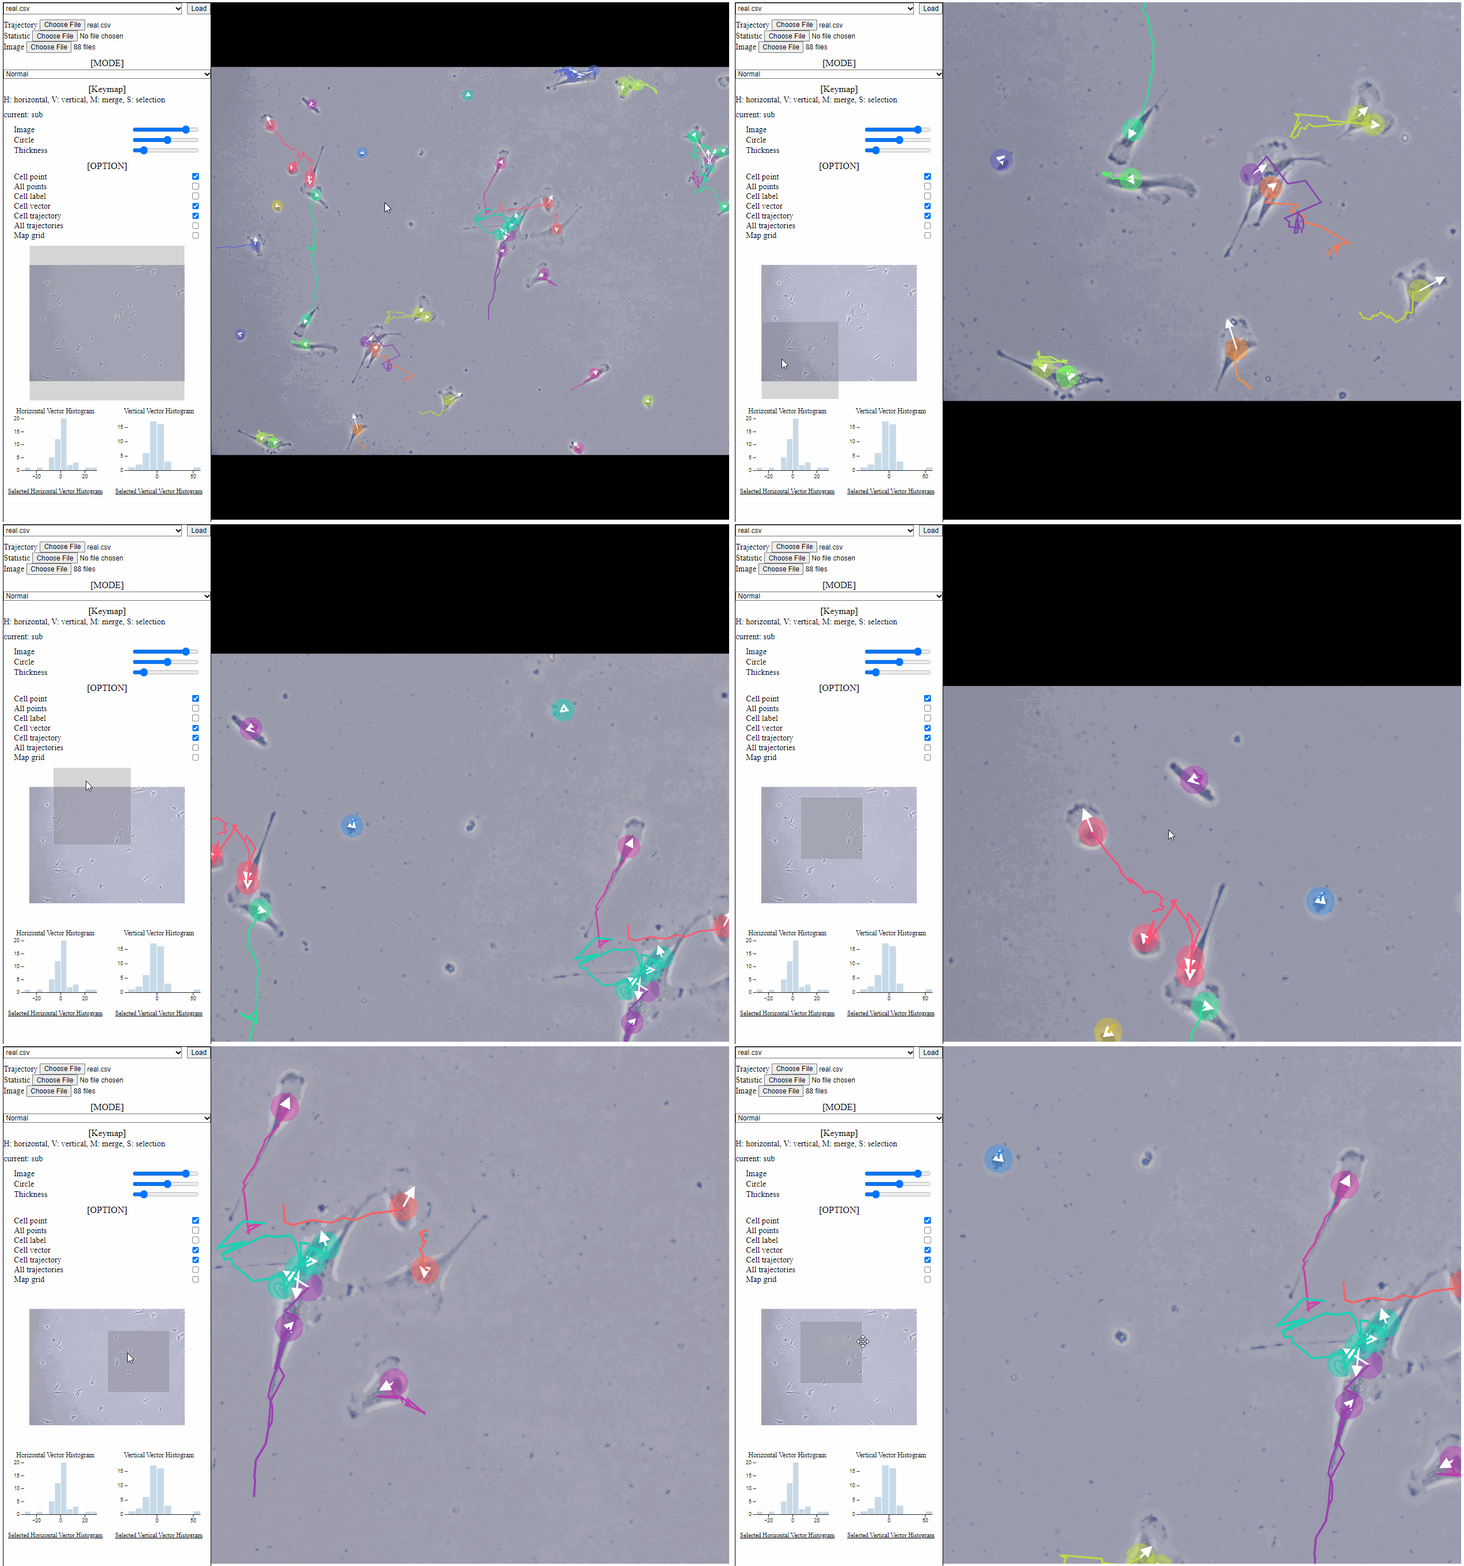
- Region can be zoomed in and out using mouse scrolling.
- Region can be moved using mini map as well.
Space partitioning

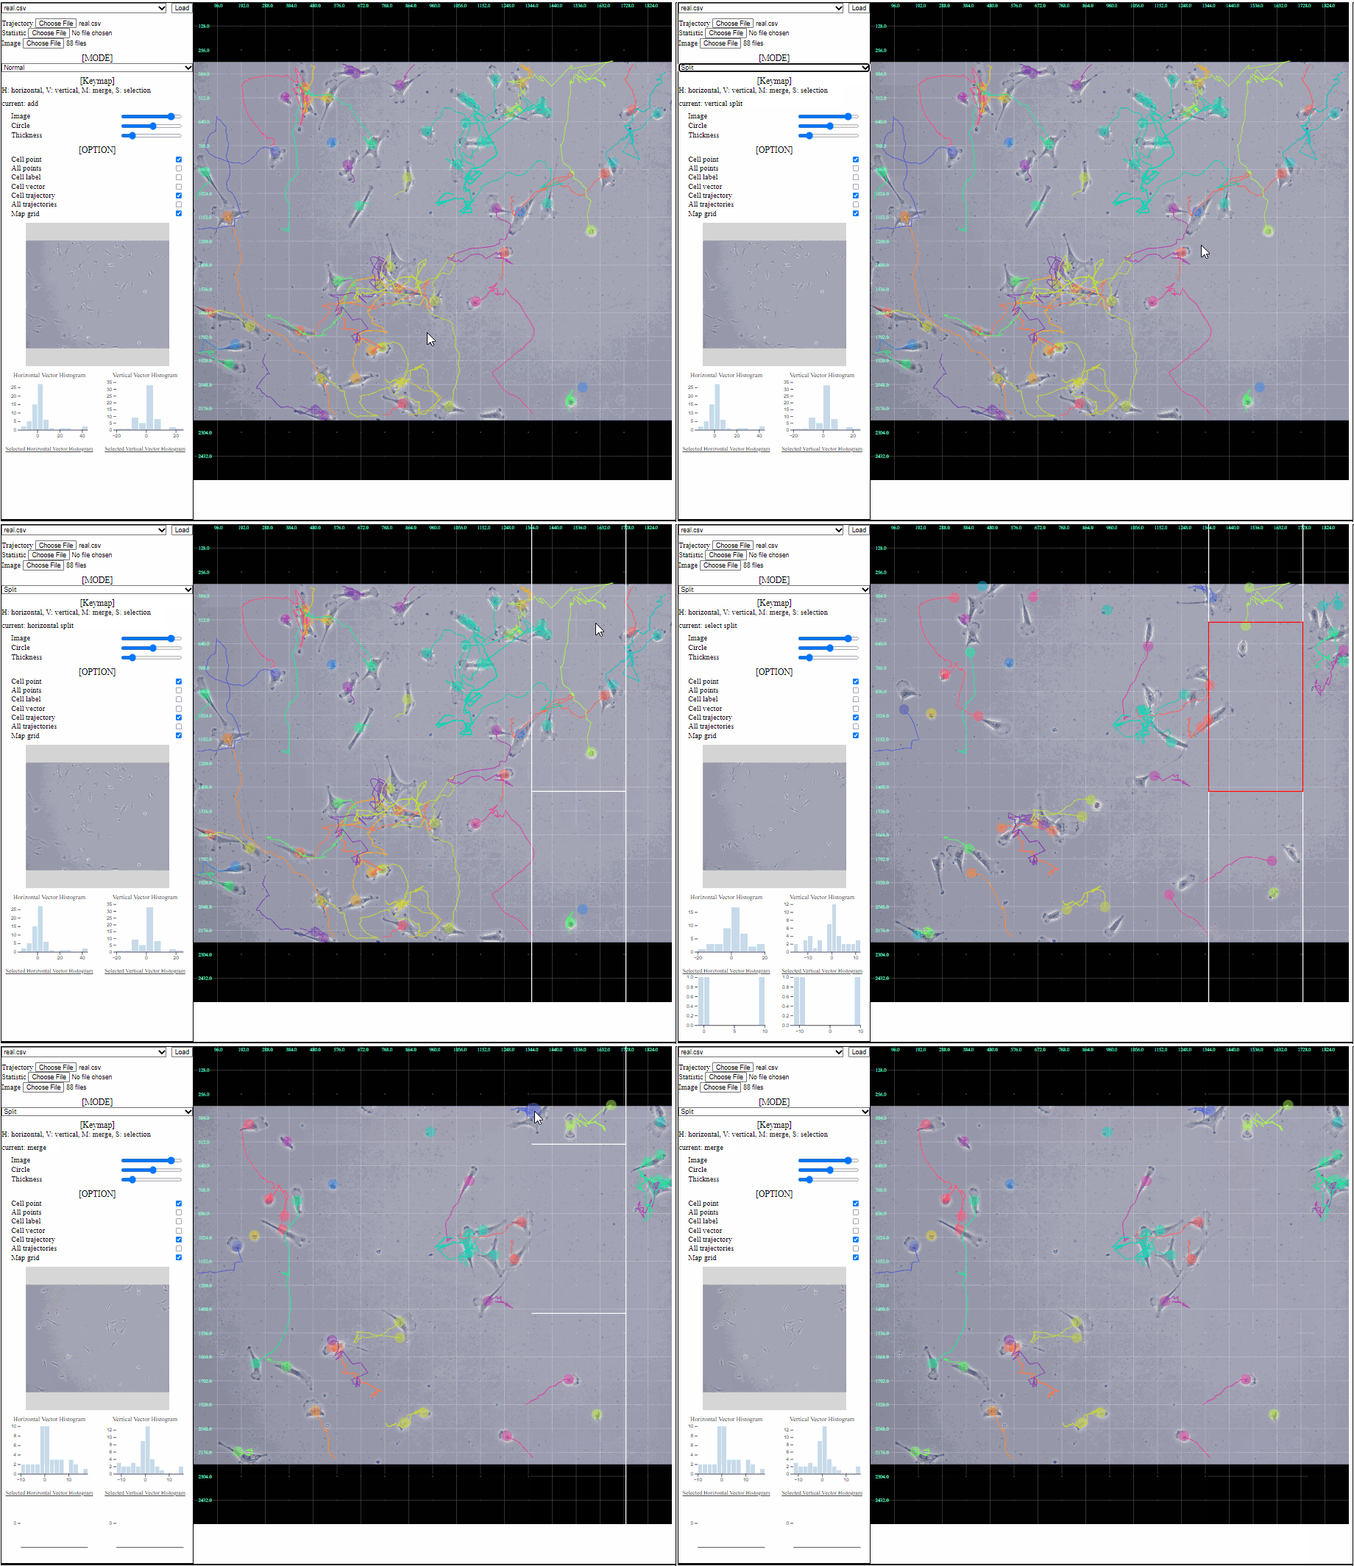
- Users can focus on some areas by selecting region of interest in the split mode.
- Key map:
- H: horizontal line
- Make a horizontal line by clicking where you want to split.
- V: vertical line
- Make a vertical line by clicking where you want to split.
- S: ready for selecting an area
- Select a region by clicking the plane.
- Histograms about the selected area appear.
- M: delete line
- Delete a line by hovering the line.
- H: horizontal line
Note: Current (split) sub-mode can be found under the key map instruction in the setting view.