This page describes how to use the Setting view of CellTrackVis.
Data upload
Cell tracking results are uploaded through three buttons:
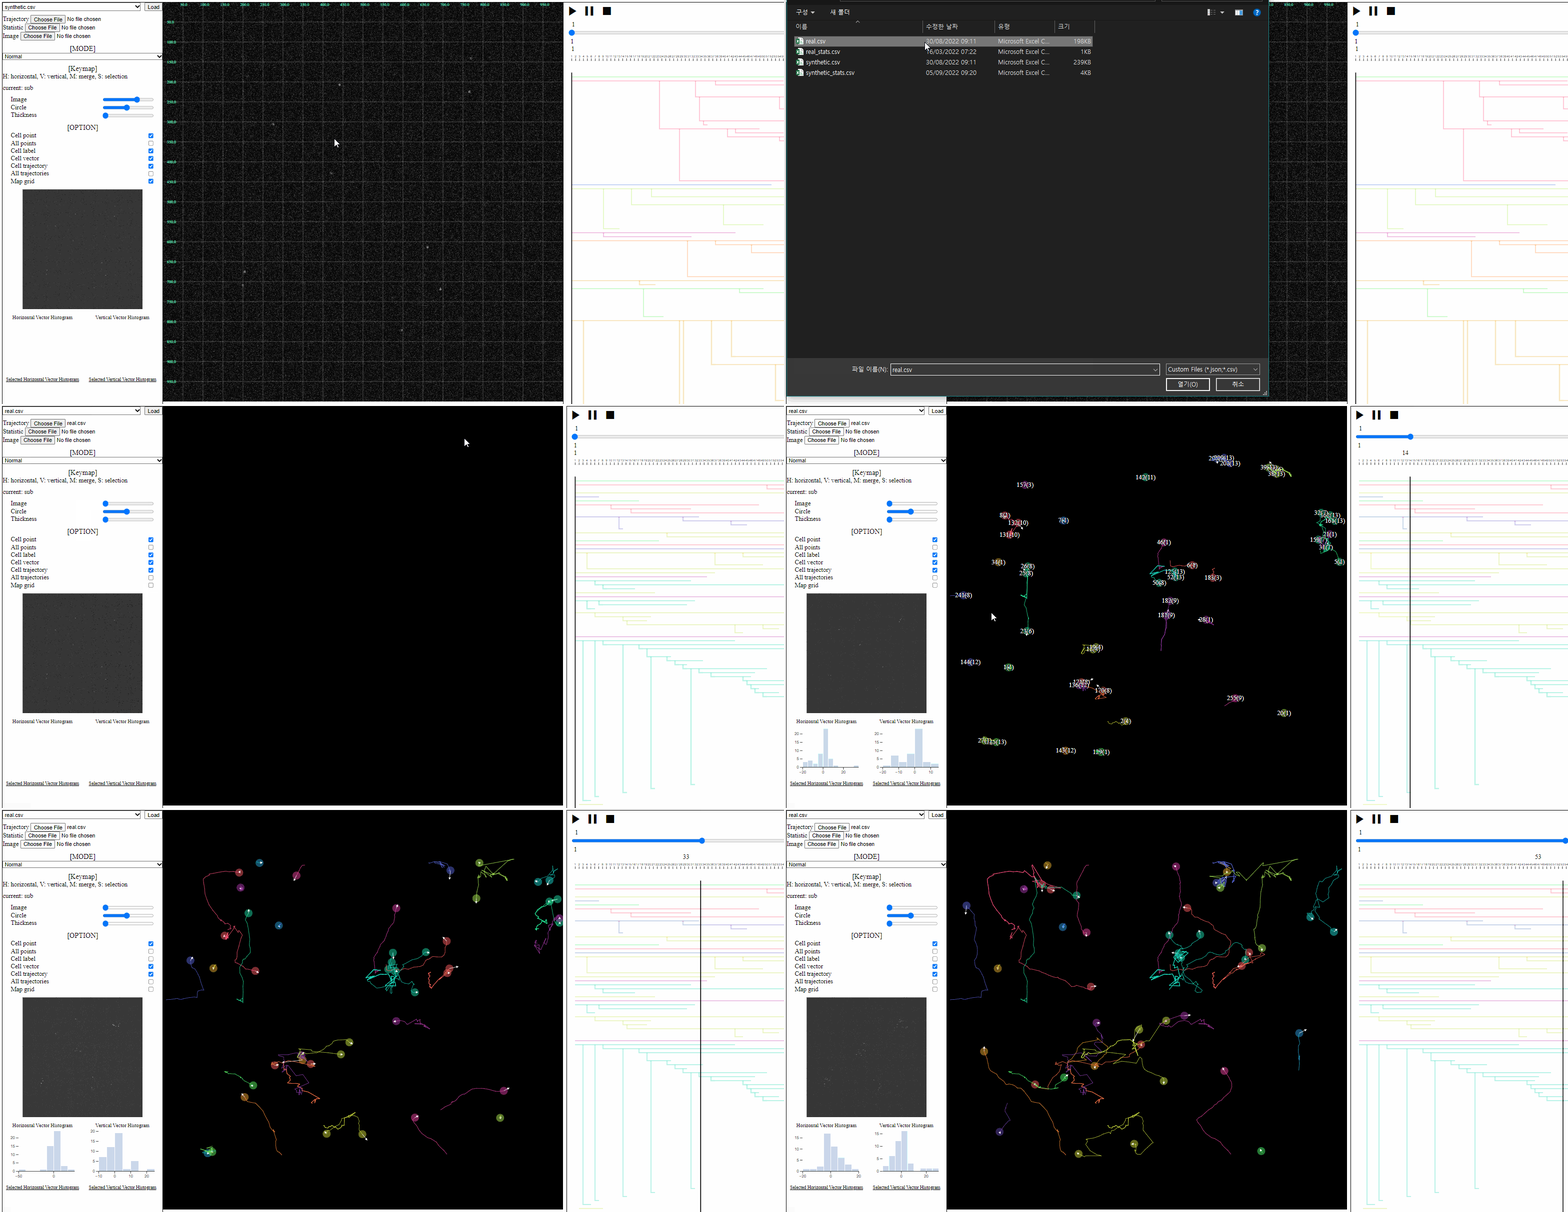
- Trajectory file: a csv file containing trajectory+lineage information
- Loaded trajectories and/or lineages are appeared in the trajectory view.
- Set the lowest transparency (black) if there is no background image in the current analysis.
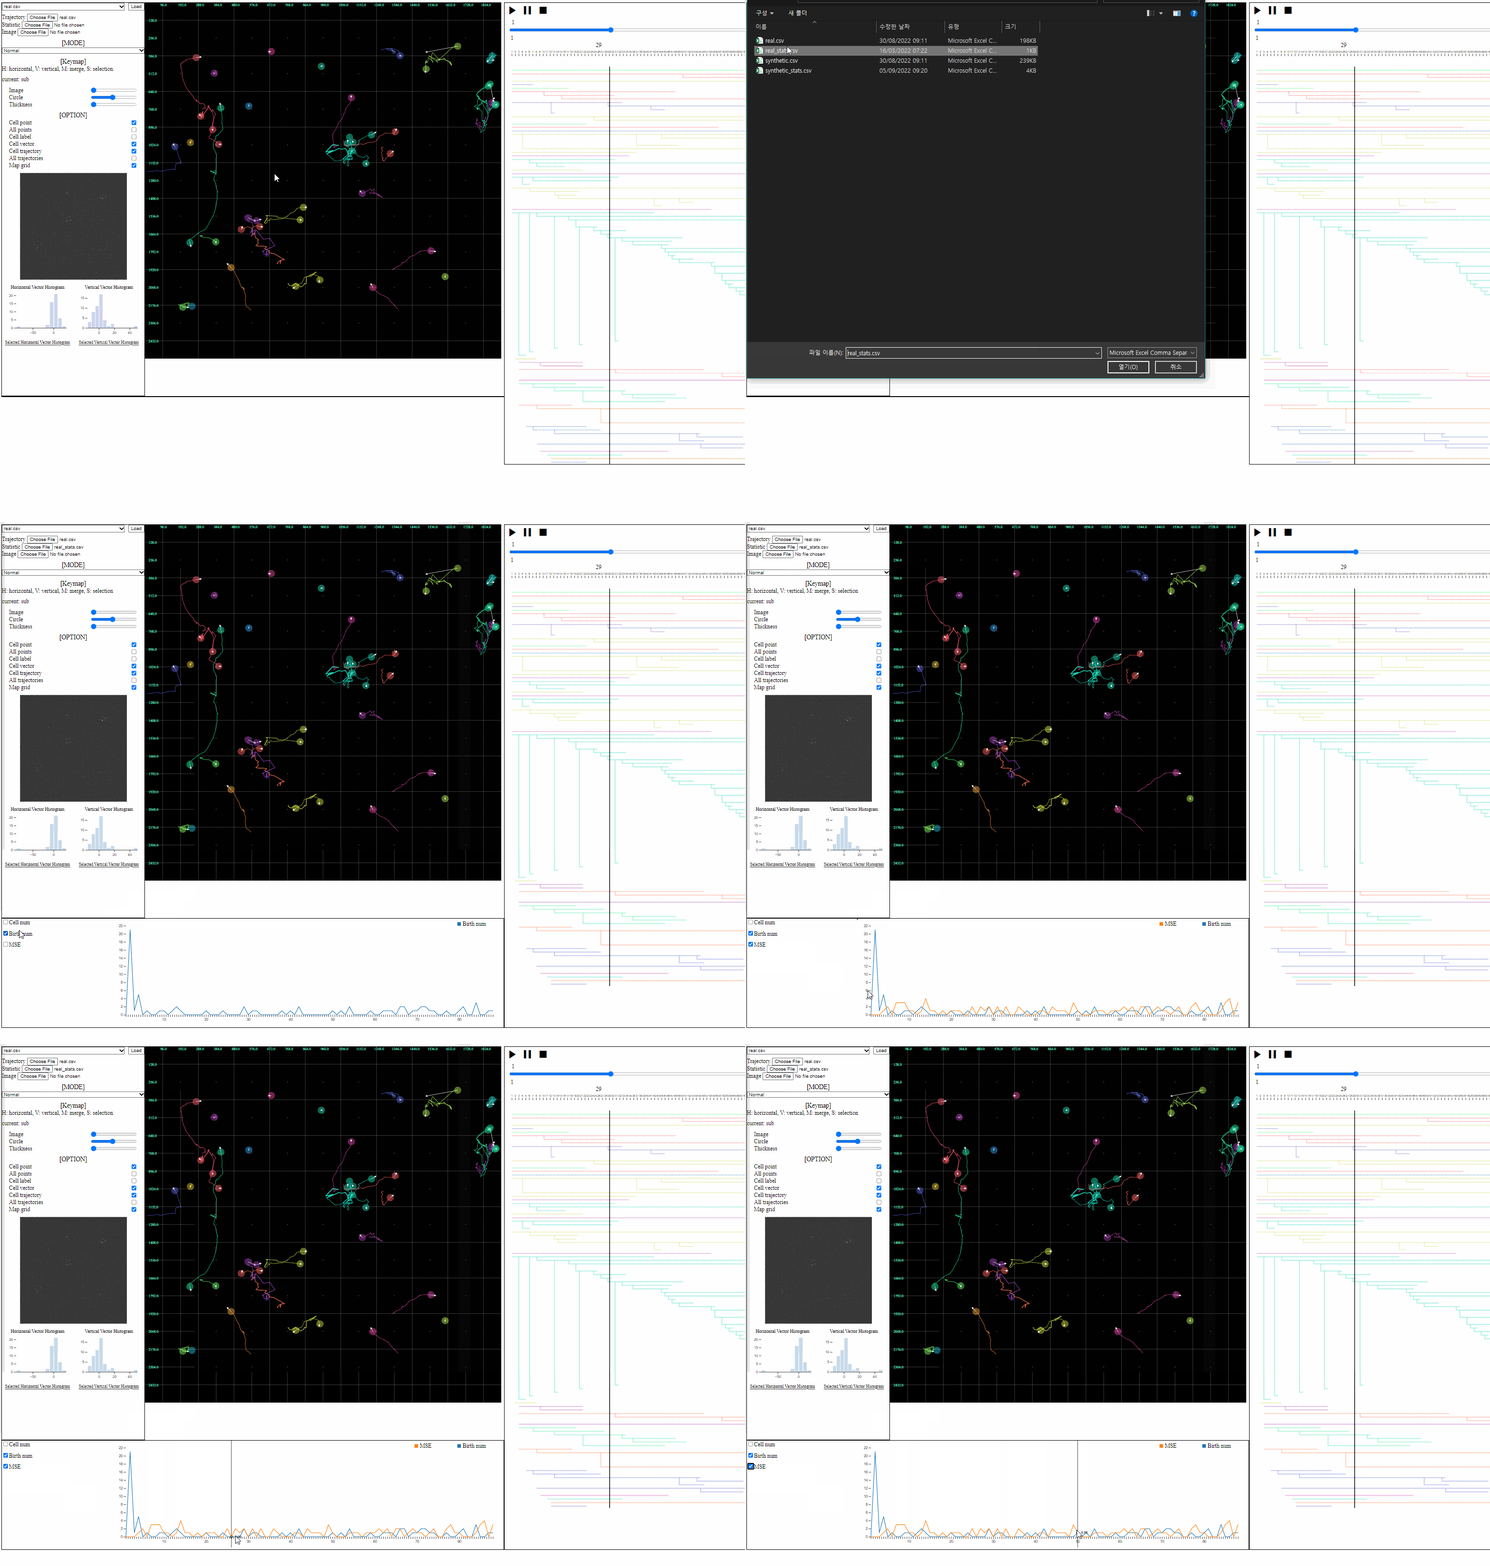
- Statistic file: a csv file containing quantified information such as errors, the number of cells, and the number of mitosis
- Loaded statistics are appeared in the statistic view.
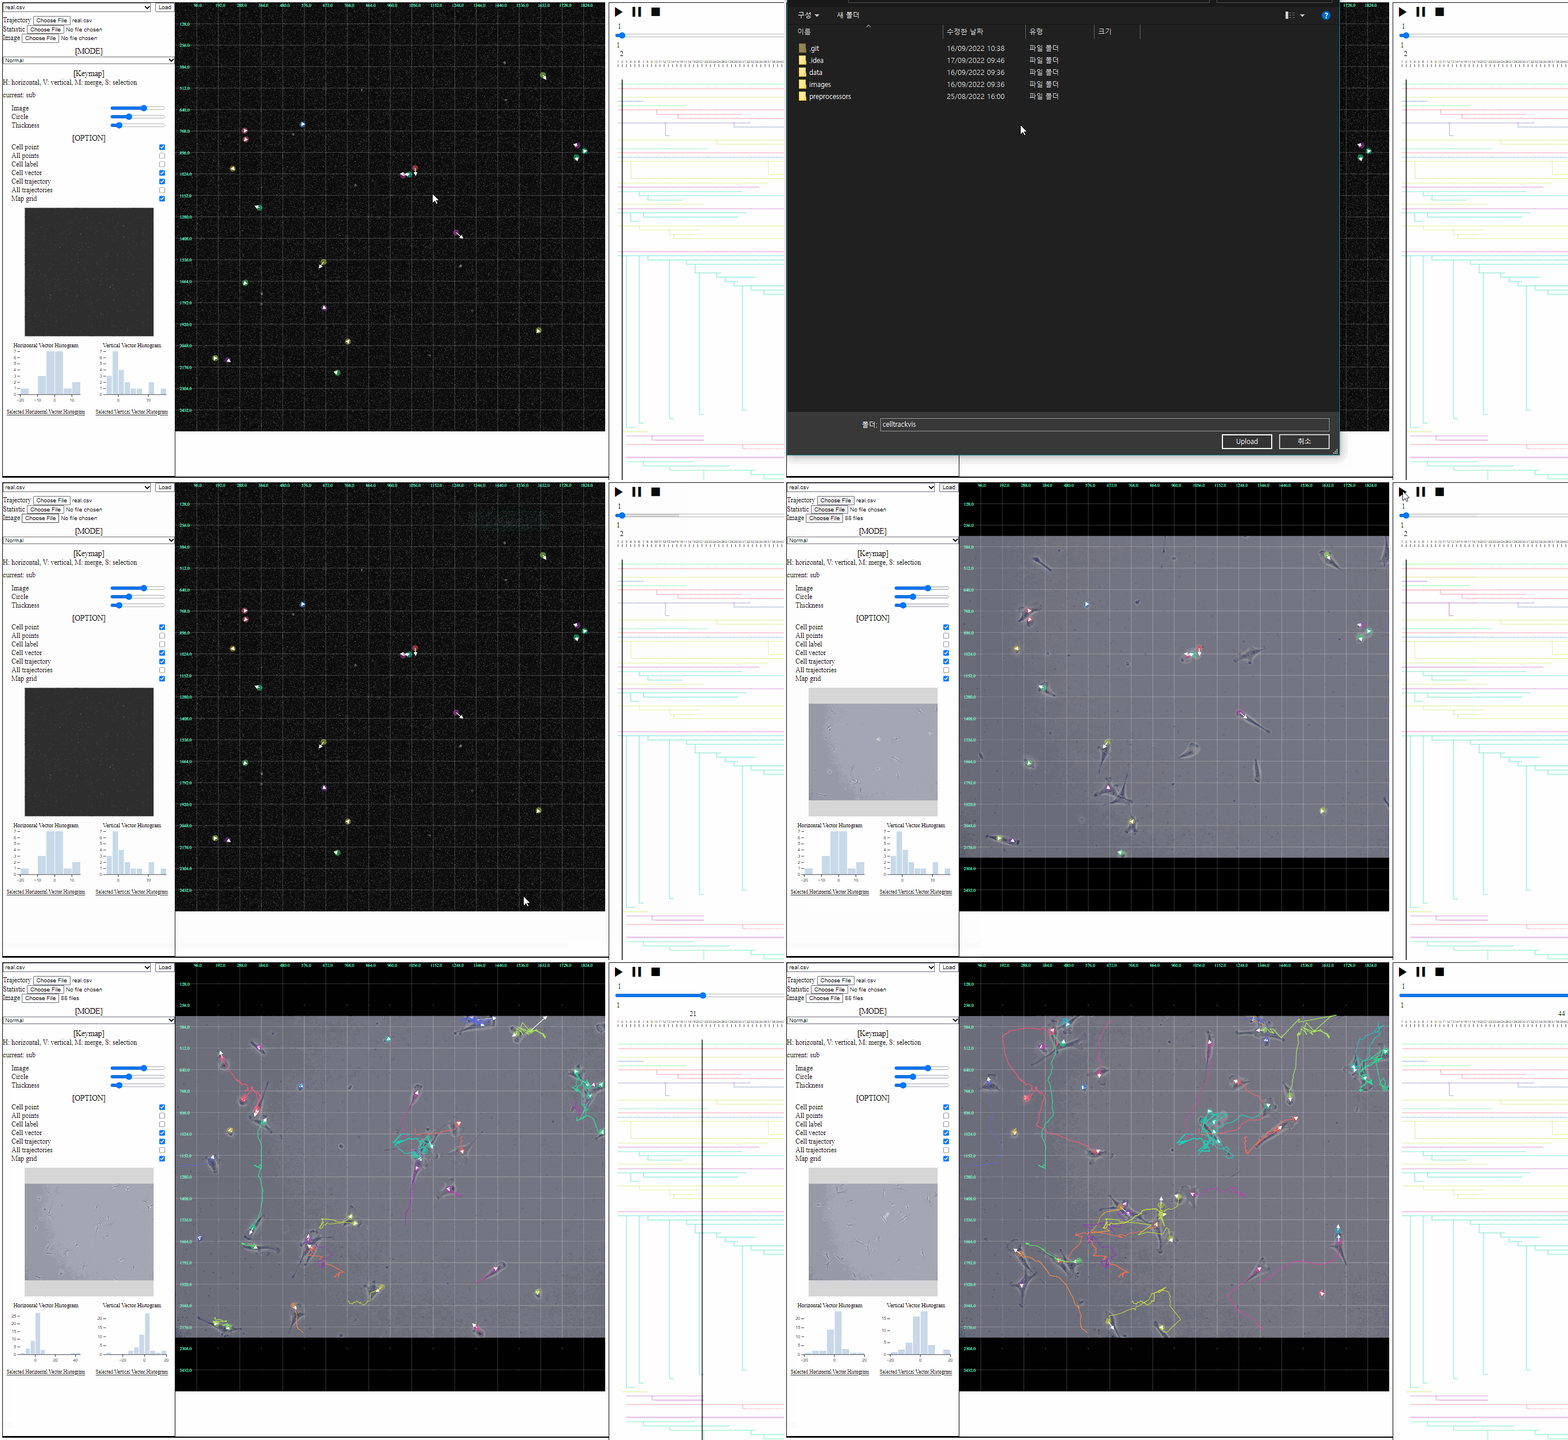
- Image file: a folder having the sequence of background images
- Loaded images are appeared in the trajectory view as backgrounds.
Important: Trajectory with lineage files must be in the ‘data’ folder, and image files must be in the ‘image’ folder.
Split functions for trajectory view
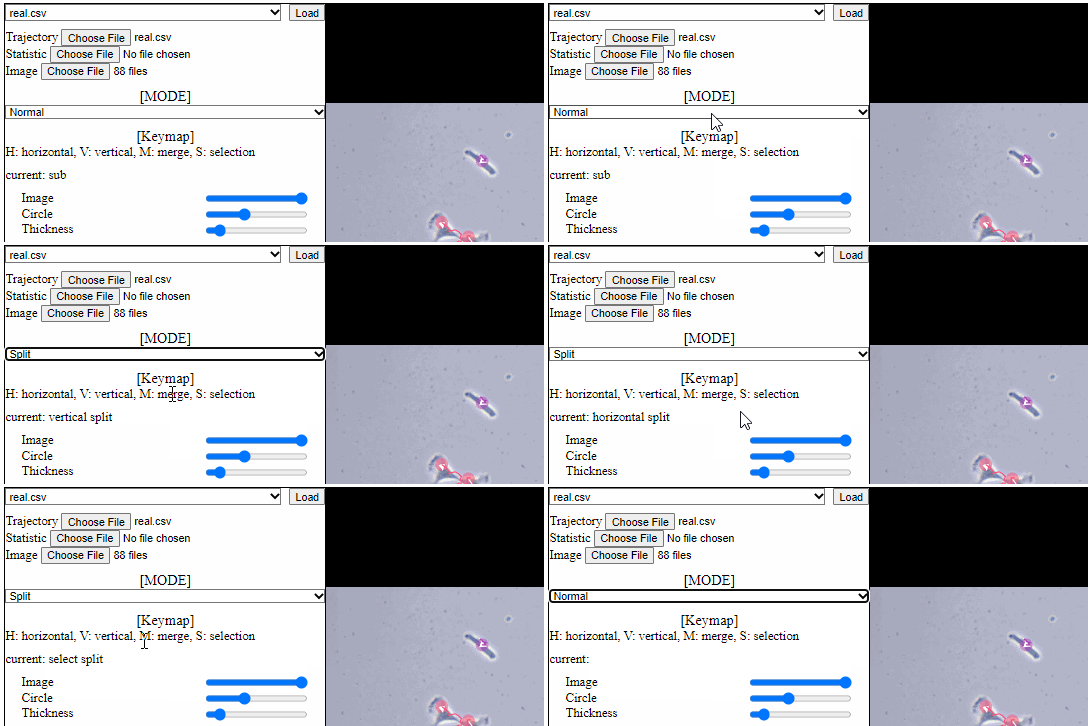
- Split mode
- For a detailed analysis in a specific area, trajectory view can be divided using “horizontal” or “vertical” lines.
Tip: More specific usages can be found in [Examples][ex_example_1].
Option controller for trajectory view
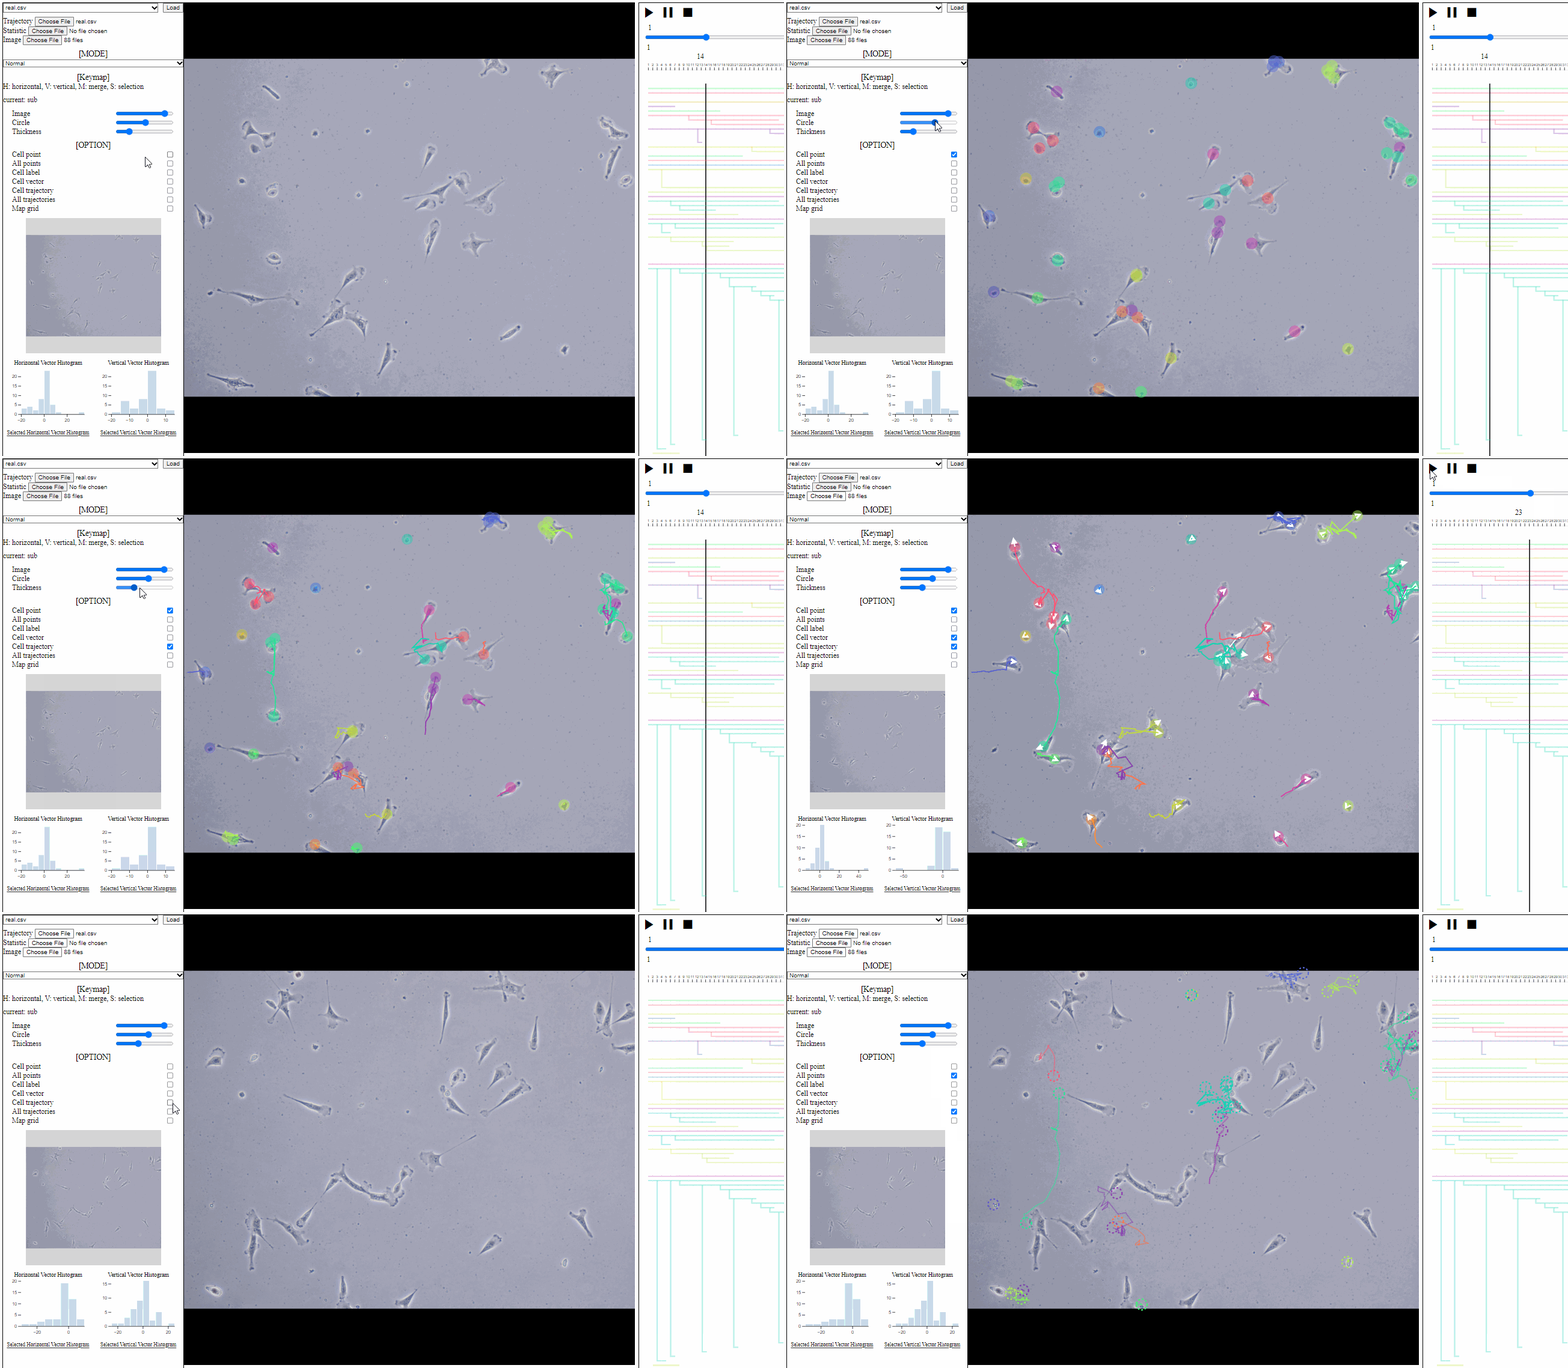
- Bar
- Image: the transparency of image backgrounds
- Circle: the size of (cell) circles
- Thickness: the thickness of trajectories (with vector arrows)
- Tick box
- Cell point: toggle for positions of cells, which have not disappeared
- All points: toggle for dotted circles on positions of all cells (disappeared at current time)
- Cell label: toggle for cell labels composed of an identifier and the birth time
- Format: id(birth time)
- Cell vector: toggle for vectors of cell direction (to the next time step)
- Cell trajectory: toggle for linked lines between previous and current positions of cells (currently appeared)
- All trajectories: toggle for dotted linked lines between previous and current positions of all cells (previous and current)
- Map grid: toggle for grid lines on the entire area
Mini map for trajectory view
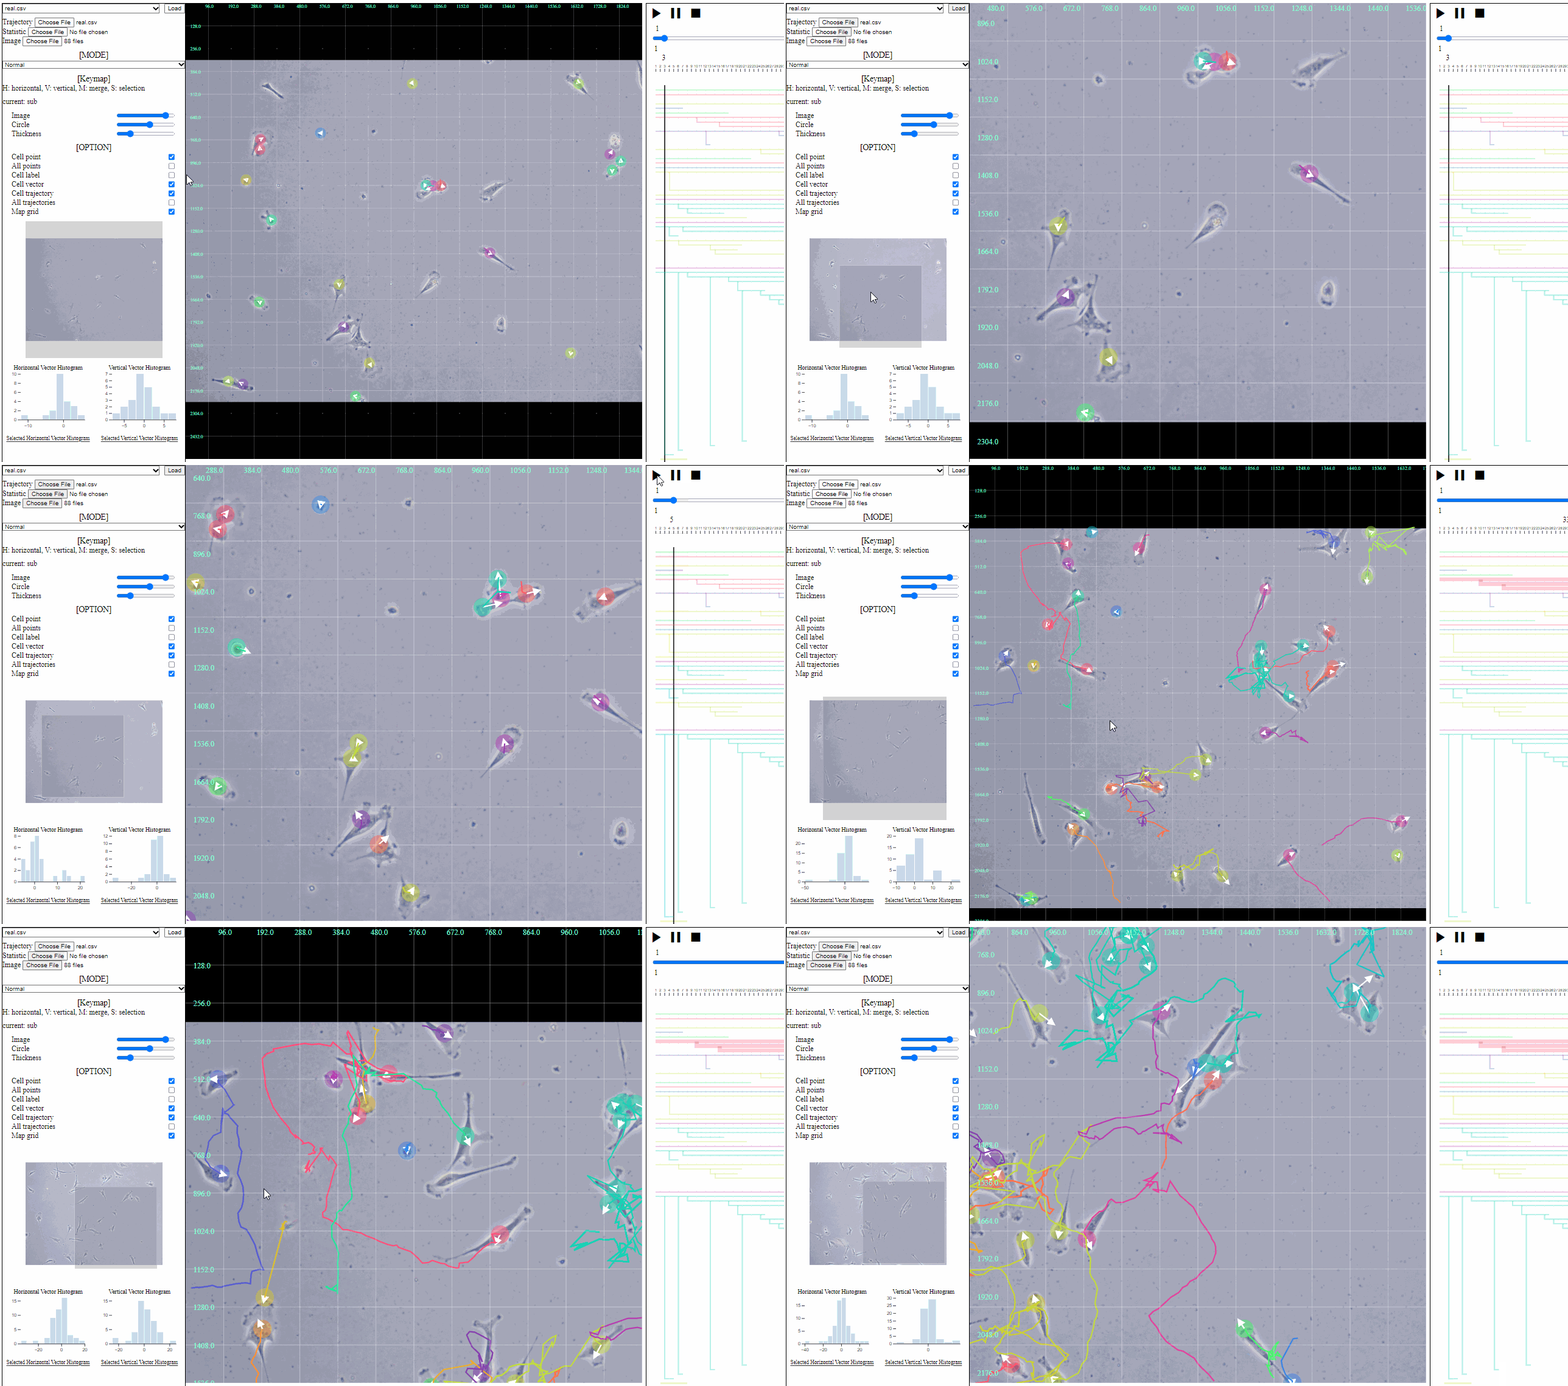
- Mini map
- Zoomed region is navigated using the minimized map.