This page describes how to use the Statistic view of CellTrackVis.
Tick boxes

- Uploaded data such as errors, the number of mitosis, and the number of appeared cells are plotted over time.
- Vertical line helps users to elaborately check quantified information.
- Visualized data can be hided by ticking unnecessary one in some cases.
Velocity histograms

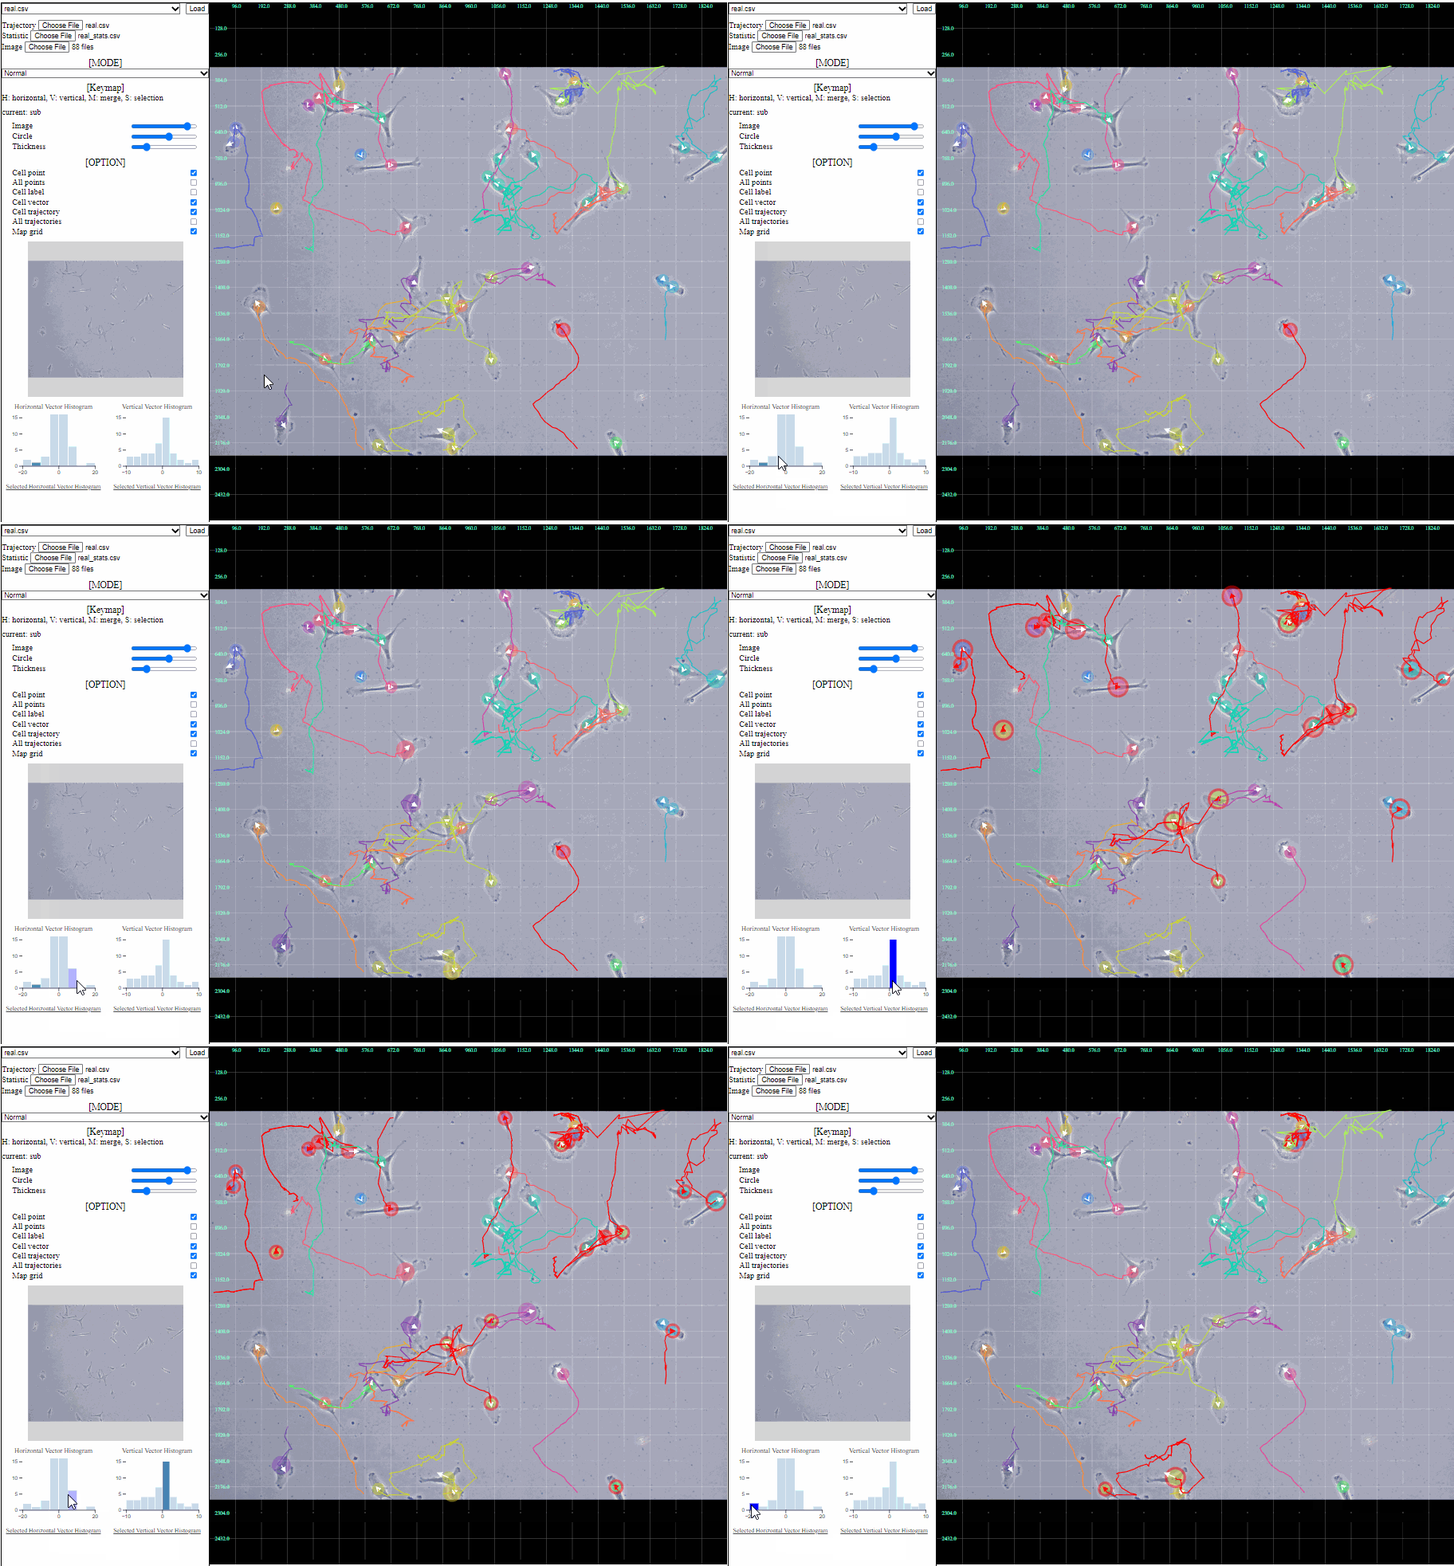
- The number of cells having each velocity (direction) vector are plotted at the left-top.
- When wanting specific population, users can click a histogram bar for highlighting corresponding cell trajectories.
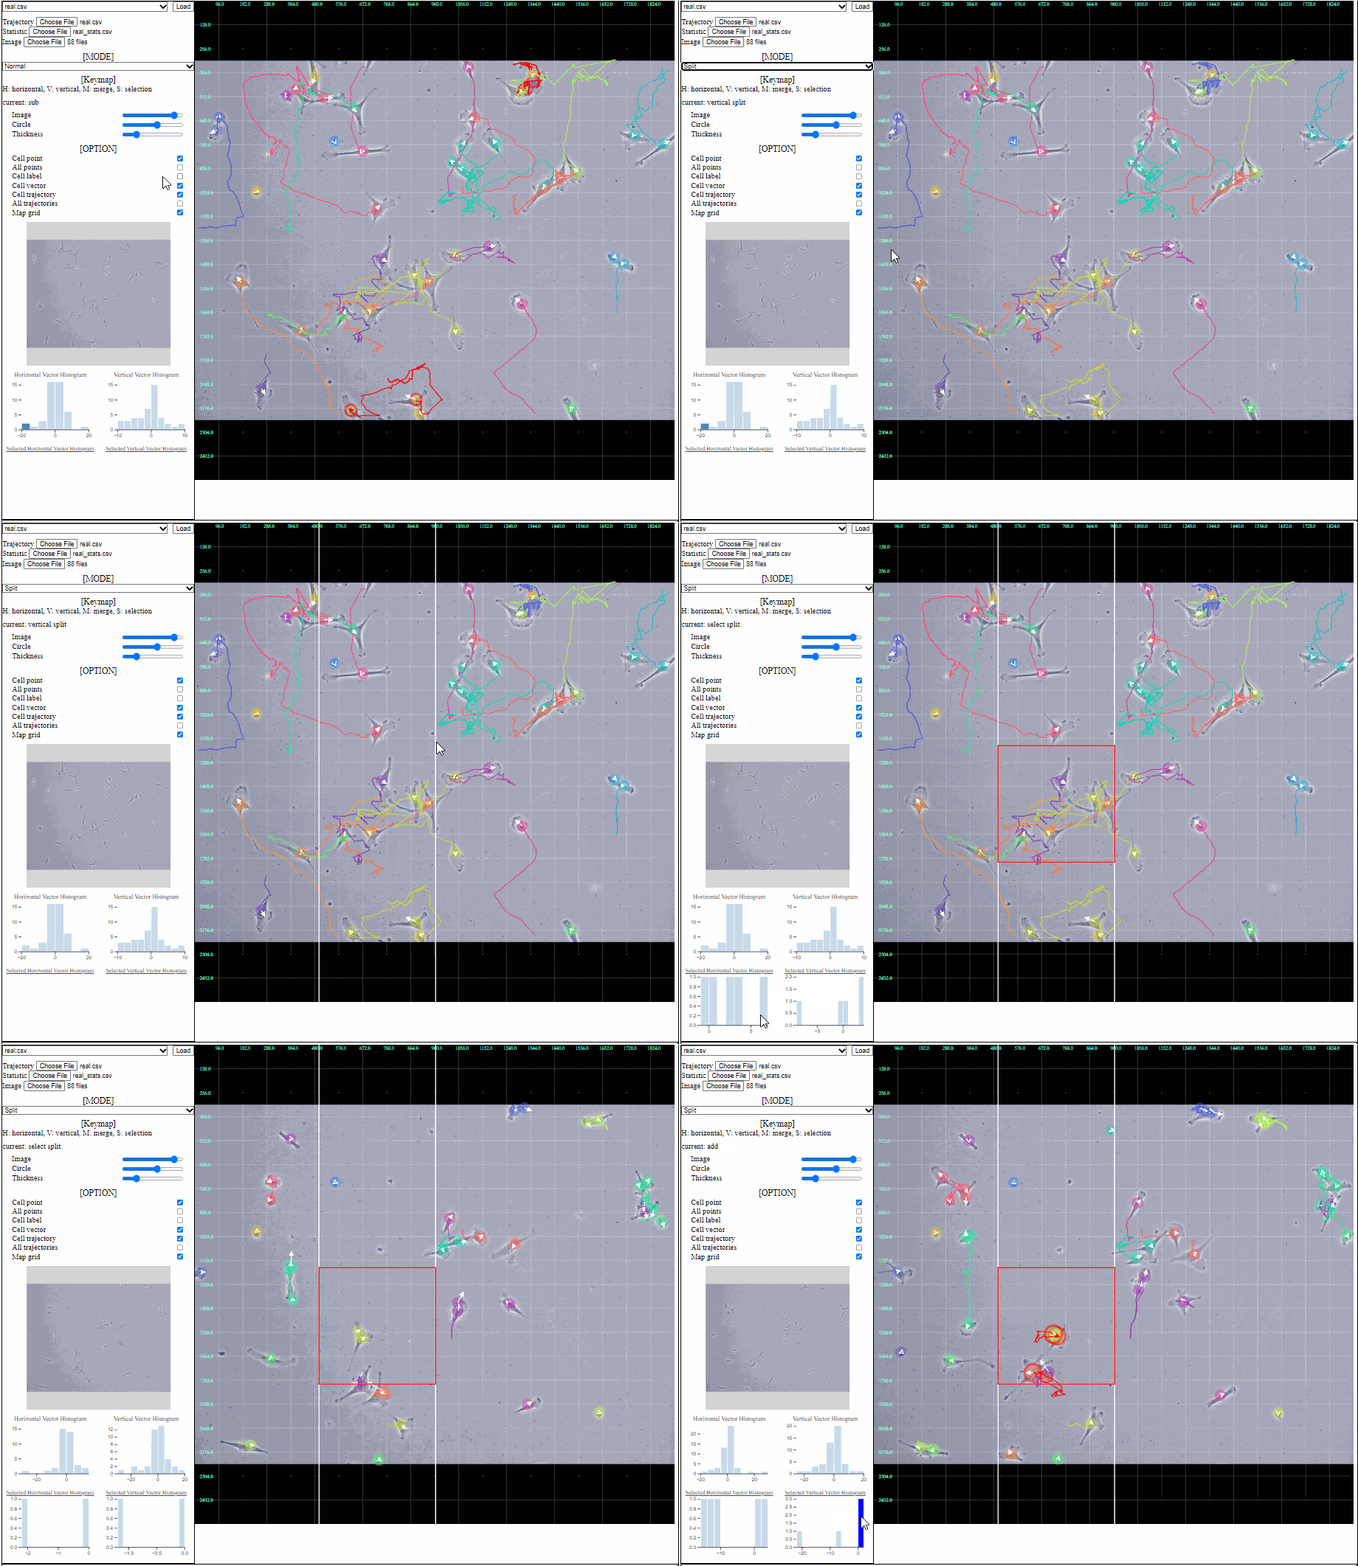
Area selection

- Each histogram of a selected area on trajectory view is shown.